


The Ineffable Beauty of the Normal Distribution

Disclosure: I’m not a mathematician or statistician. There are numerous places online where you can learn about the mathematical characteristics of the normal (or Gaussian) distribution (AKA the Bell Curve). This posting is more of a personal tale of how my thinking has been influenced by learning about the distribution and its characteristics – and why I think no one should be able to graduate from high school without learning about the distribution and its implications for understanding individual and group differences.
My first exposure to the normal distribution was in a high school statistics and probability course. The focus in that class was actually on the binomial distribution: the probability of obtaining a certain number of successes in a fixed number of independent trials, where each trial has only two possible outcomes: success or failure. The classic example (and the one we discussed in that high school class all those many years ago) is the distribution of “heads” coin flips that come up if you were to flip a coin, for example, 100 times – then plotting the number of heads from doing that thousands of times. The important point here is that, even though the binomial distribution is related to a distribution of discrete events (a coin comes up either heads or tails, and out of 100 flips, the number of heads is a discrete number) whereas the normal distribution maps values of a continuous measure (e.g., height), as the number of trials of a binomial event increases, the distribution of outcomes will come to more and more closely resemble a normal distribution – a phenomenon which, to my high school mind at the time, was quite fascinating.
But what really impressed me (at that time, and ever since) about the normal distribution was its ubiquity. In class, we discussed a variety of phenomena in nature that were distributed in this manner, and for me, at least, noticing evidence of normal distributions quickly became something like visiting England and noticing that Brits are less likely than Americans to have orthodontics during their teen years – that is – once you become explicitly aware of the phenomenon, you see evidence of it everywhere you look.
For example, in our hometown newspaper at the time, the sports section listed all golf scores for PGA tournaments. I started roughly graphing the scores (and yes – I realize what an odd thing that was to do, and how surprising it is that a teenage male who did that sort of thing would eventually be successful in finding and falling in love with and marrying a very attractive woman), and couldn’t help but notice how uncannily close the resulting graphs were to a normal distribution. And what seemed particularly fascinating was that, even after the field of golfers in a tournament was reduced to just the top 50% or so of the scores after the first two days of play, after that, the scores of the remaining players would still follow a normal distribution pattern during each of the final two days.
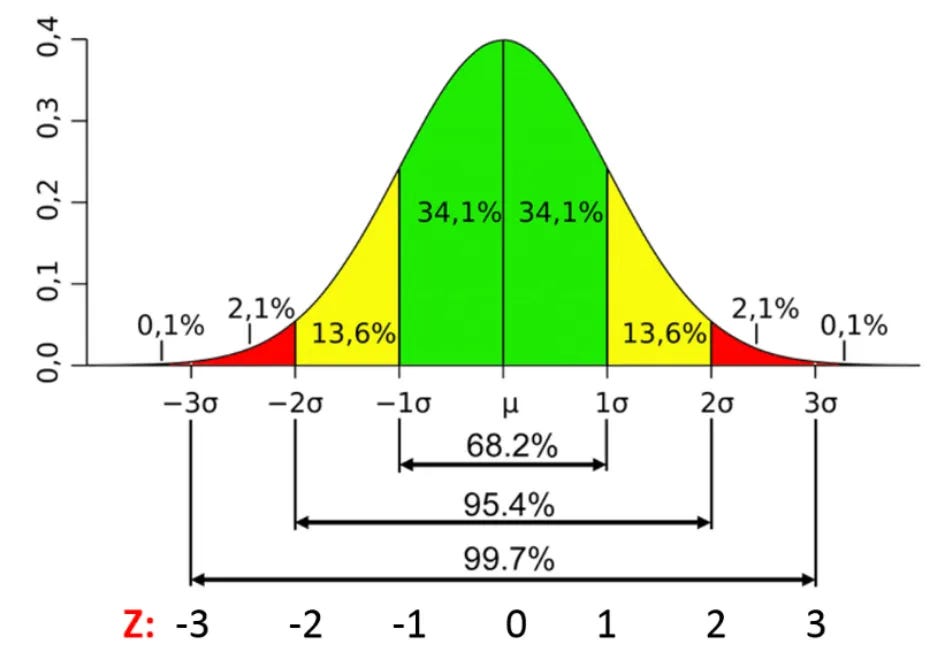
Beautiful eh! Some other normally distributed measures or scores include:
Birthweight of babies
Height of males
Male foot sizes
ACT scores
NFL player retirement ages
Basically, it is as if the normal distribution is the default assumption of how measures of a characteristic or phenomenon are distributed, and there is no need to seek an explanation for why the characteristic is distributed in that manner. However, when the measure of a characteristic is NOT normally distributed, there IS a need to explain that discrepancy. The explanation may involve a feature of the measuring device that was used (perhaps, for example, the device was not sensitive to individual differences at the upper part of the range – which is often the case with the exams that professors use to assess student learning, and as a result, the distribution of grades is often highly skewed), or may reflect a phenomenon affecting a subgroup of the population being measured (as, for example, would be the case if a small percentage of individuals in a population have a disorder that affects physical growth, resulting in a small second mode in the distribution of heights toward the lower end of the distribution).
Ultimately, what really solidified my affection for the normal distribution was when we learned about the central limit theorem (CLT). According to the CLT, if you measure a characteristic of members of a population, and if you repeatedly take sufficiently large samples from the population, the distribution of sample means will be normally distributed, even if that characteristic in that population isn’t normally distributed. For example, even though the distribution of grades at most colleges is not normally distributed (because of grade inflation there is an overabundance of high grades), if you (1) randomly select a sample of, say, 100 rising sophomore students from Yale, then (2) you calculate the sample mean of the students’ first year grades, and then (3) you repeat this process (with replacement) 500 times, the distribution of the sample means will be normally distributed.
Another example of this amazing phenomenon (shamelessly copied from https://www.scribbr.com/statistics/central-limit-theorem/ )
Suppose that you’re interested in the age that people retire in the United States. The population is all retired Americans, and the distribution of the population might look something like this:

Age at retirement follows a left-skewed distribution. Most people retire within about five years of the mean retirement age of 65 years. However, there’s a “long tail” of people who retire much younger, such as at 50 or even 40 years old. The population has a standard deviation of 6 years.
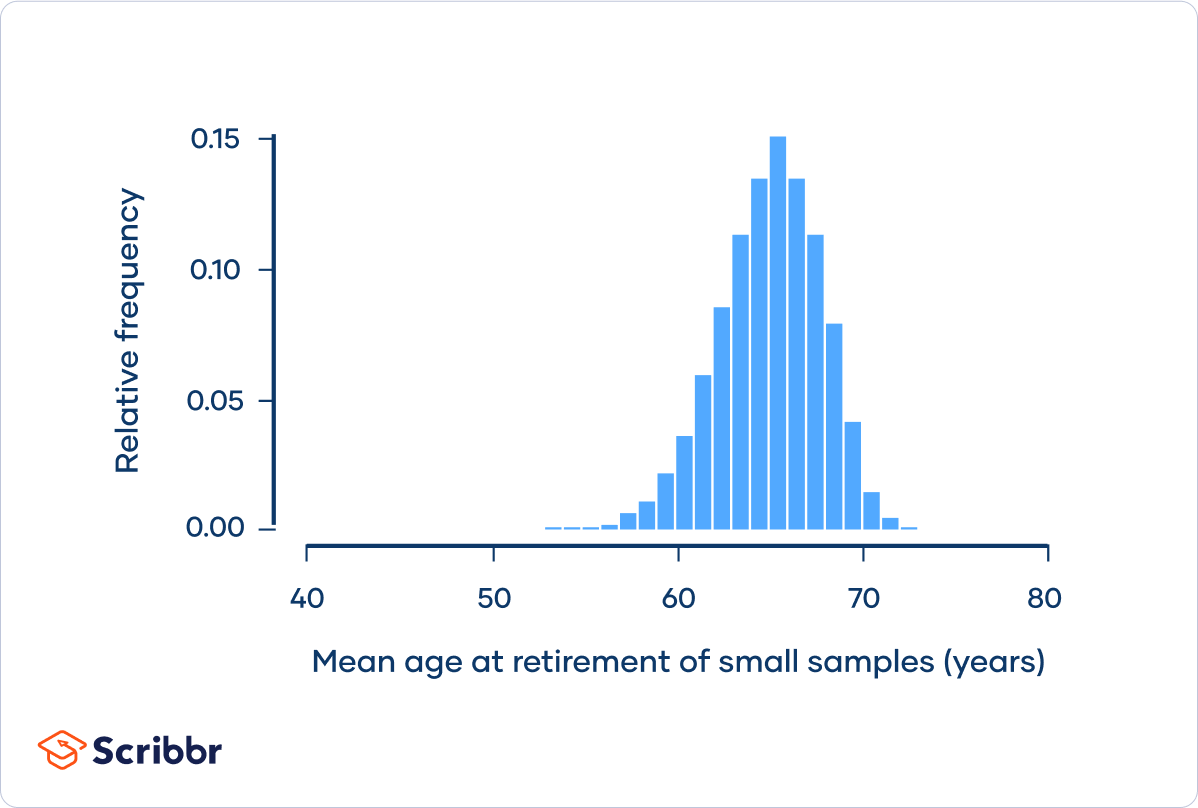
Now, imagine that you take a reasonable sized sample of the population. You randomly select 50 retirees and ask them what age they retired and record the mean of this sample – and then you repeat this process hundreds of times.
In the histogram, you can see that this sampling distribution is normally distributed, as predicted by the central limit theorem.
So – even when the distribution of a measure is not normally distributed, the normal distribution is lying in wait to be revealed when you take samples from that population! There is no escaping it!
There are some important implications of the CLT for statistics — but I’m not going to discuss those at all here. Instead I want to focus on two very simple, but highly related and deeply consequential, features of the normal distribution of a characteristic measured from two different populations.
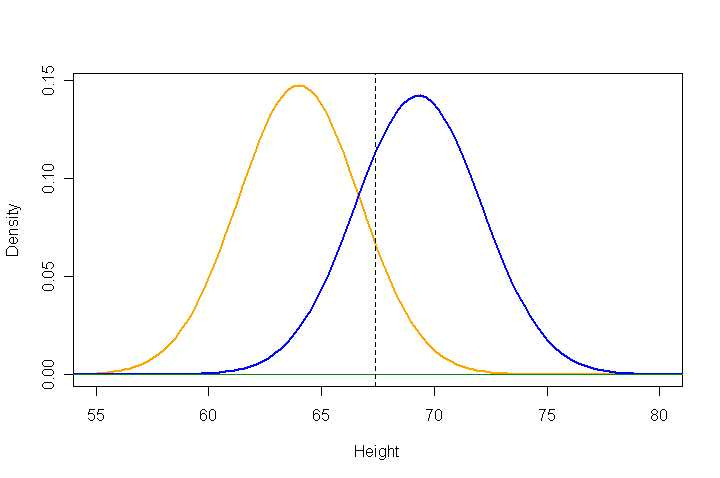
The example I’ll focus on is the height of males and females. On average, males are taller than females. ON AVERAGE. Obviously, not ever male is taller than every female. Indeed, note (in the image below) that in the area between the means of the two distributions, there are approximately equal numbers of males and females. HOWEVER, at the extremes of the range of heights, there is a huge difference between the numbers of males and females. For example, while there certainly are SOME women taller than 6'3" in height, they represent only a tiny percentage of people who are taller than that height. Another way of saying the same thing: even though there is only a modest difference between the average heights of males and females, almost everyone who is very tall is male. In the graph below, height is in inches, males are represented by the blue line and females by the mustard yellow line.
A related phenomenon occurs when two overlapping distributions differ in variance:
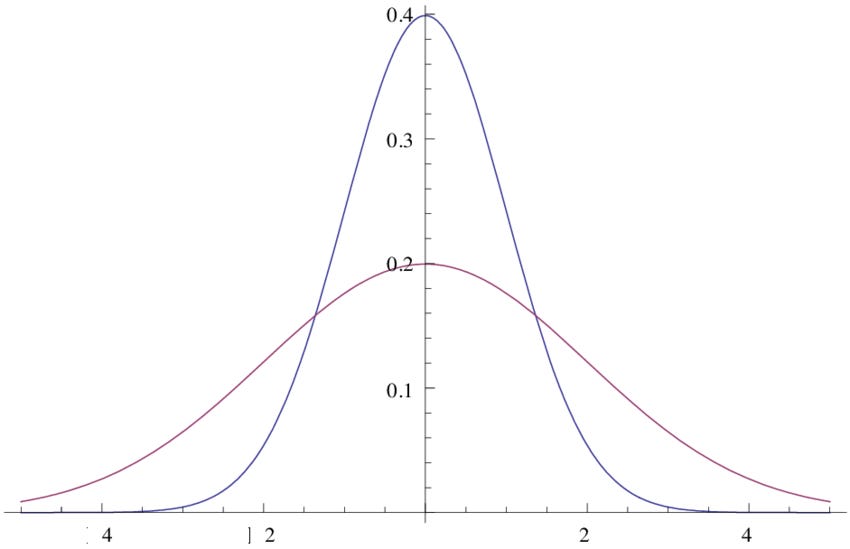
Imagine that the blue line represents the distribution of a characteristic in females, whereas the red line represents the distribution of that same characteristic in males. Even thought the means of the two normal distributions are the same, because the variance of the male distribution is greater than the variance of the female distribution, at the extremes of the range of this characteristic (both high and low), most of the people at that level are male.
These phenomenon have important implications for our understanding of, and perception of, group differences in characteristics. If, for example, our perception of a group difference in a characteristic is highly influenced by our experience of the kinds of people who score very highly on that characteristic (which, by the way, is the case), then it will be our sense that the group difference is real, and perhaps large, even if the real difference in average levels of that characteristic are quite small — because even with a very modest difference in mean scores, the higher scoring group will be highly over-represented amongst those who score very high on that characteristic.
In fact, a lot of stereotypes about ways in which groups differ are driven by our experience with people who are very high in that characteristic. For example, consider the case of physical aggression. Most people – both males and females – are not very physically aggressive. And there are some males and some females who are highly aggressive. But – males are, on average, more physically aggressive than are females, and that difference in averages translates into a huge difference in the representation of males and females amongst those who are very highly aggressive.
And now consider the question of sex differences in mathematical ability. If the mean of the math ability distribution for males is even very slightly higher than it is for females — OR if the variance of the distribution for males is slightly greater than it is for females — then there will be a large overrepresentation of males at the upper end of the distribution – a difference that could translate, for example, into an overrepresentation of males amongst those who major in math (or highly math dependent subjects) in college.
All of this seems pretty simple and obvious – so much so that one would expect that any reasonably intelligent and well educated individual would understand these features of overlapping normal distributions. Indeed, I think it would be reasonable to expect these concepts to be easily understood by any high schooler who has passed courses in algebra and geometry. And yet ...
Failures of understanding of overlapping normal distributions
Perhaps the most fundamental, and simple, and obvious, implication of overlapping normal distributions is that, for any particular characteristic, there can be a real difference (on average) between two groups while at the same time, the distributions for the two groups may be highly overlapping – and therefore, SOME members of the group that, on average, scores higher on the characteristic will score lower on that characteristic than some members of the other group. For example (and yes – it is painful to go to these lengths to point out something so obvious and simple), males are taller (on average) than females, but some females are taller than some males. And the fact that some females are taller than some males does not negate the truth that males, on average, are taller than females.
Is it really possible that some well educated individuals don’t seem to understand that trivially obvious notion? Shockingly – yes. In discussions of whether or not trans women (biological males who self-identify as girls or women) have a male advantage in athletics, an argument that is sometimes made is that the fact that trans women do not always outperform biological women is evidence against trans women having a male advantage.
For example – the following quotes are from the official website of the city of San Francisco government. The page is titled “Trans Women in Sports: Facts Over Fear: Resources to combat misinformation around trans women's participation in sports” and the content was posted by the San Francisco Office of Transgender Initiatives. That office includes the following as part of its argument that trans women should be permitted to compete in the women’s category in all sports:
In 1977, Renee Richards competed in women’s tennis as a trans woman and reached the doubles final in the US Open; however, she did not win. Richards and her doubles partner Betty Ann Stuart lost the finals to Martina Navratilova and Betty Stove. Stuart, Navratilova, and Stove were all cis-gender women.
In 2021, Laurel Hubbard competed in weightlifting at the 2020 Summer Olympics. Despite widespread media attention, she won no medals.
The fact that Richards did not win the doubles final in tennis at the U.S. Open in 1977 is only relevant to the issue of trans women having a male advantage if one completely ignores the fundamental concept of overlapping normal distributions. The same goes for Hubbard’s failure to win any medals in the 2020 Olympics. Even when there really is a mean difference between male and female distributions with regard to performance in some athletic endeavor, that does not mean that EVERY male is better at that sport than every female — and therefore, the fact that a particular male is not one of the best in the world when competing against females is not evidence against the claim that there is a male advantage in that athletic activity. This point is so simple and so obvious that it is a huge testament to the power of motivated reasoning that anyone could make the kind of argument represented by the statements above.
But the city of San Francisco Office of Transgender Initiatives is far from alone in this regard. Consider, for example, the way some have discussed the well-known case of Lia Thomas – the U. Penn male swimmer who identified as a trans woman and competed in female swimming. According to an article about Thomas in the British publication The Independent:
…post-HRT trans women do not currently dominate professional sport.
So? The implication is that there is no male advantage unless transwomen consistently perform at higher levels than ANY biological females – an argument which is breathtakingly stupid, and is based on what I assume is deliberate denial of any concepts of overlapping normal distributions.
The article continues:
Let's look first at Ms Thomas's record in the NCAA. While some of her fastest times have been in other competitions, these are the easiest results to access and compare across multiple years and athletes.
All statistics in this article are for "short course yards" races, meaning they were done in a 25-yard pool.
Ms Thomas won the women's 500 yard freestyle race in 4m 33.24s. She came fifth in the 200 yard race, with 1m 43.40s, and eighth in the 100 yard race with 48.40s.
These were impressive results, but they weren't record-breaking. Though the overall competition saw 27 all-time NCAA records broken, Ms Thomas's times weren't among them.
According to an Independent search of women's records listed by USA Swimming, the US' national governing body for the sport, Ms Thomas's 500 yard time makes her the 15th fastest college swimmer, about nine seconds behind Katie Ledecky's record in 2017.
Again – so?? This is simply NOT an argument against trans women having a male advantage in athletics. In terms of the normal distributions of athletic performance for trans women vs biological females, all the above demonstrates is that the distributions overlap!
And then, there is the sad case of the ACLU, which has argued (as part of their claim that trans women should be permitted to participate in female sports) that:
FACT: Trans athletes do not have an unfair advantage in sports.
Trans athletes vary in athletic ability just like cisgender athletes. “One high jumper could be taller and have longer legs than another, but the other could have perfect form, and then do better,” explains Andraya Yearwood, a student track athlete and ACLU client. “One sprinter could have parents who spend so much money on personal training for their child, which in turn, would cause that child to run faster," she adds. In Connecticut, where cisgender girl runners have tried to block Andraya from participating in the sport she loves, the very same cis girls who have claimed that trans athletes have an “unfair” advantage have consistently performed as well as or better than transgender competitors.
So – according to the ACLU – trans athletes do NOT have an advantage in sports as evidenced by the fact that some biological girls “performed as well as or better than transgender competitors.” The implication is clear and straightforward. According to the ACLU, unless trans girls and women outperform all biological girls and women, “trans athletes do not have an unfair advantage in sports” — an argument that is simply mind-bogglingly dumb.
So yes – there really are well educated, probably otherwise-intelligent-people, who have made an argument that stupid.
But perhaps the most infamous case of well educated individuals failing to understand overlapping normal distributions occurred in 2005 when Harvard President Larry Summers claimed (according to some) that females are innately less capable than males at doing science.
BUT – that ISN’T what Summers claimed! What he ACTUALLY said (in reference to mathematical ability and the underrepresentation of females in some STEM disciplines) was:
“There is relatively clear evidence that whatever the difference in means—which can be debated—there is a difference in the standard deviation and variability of a male and female population”
Even the venerable, and occasionally accurate, NY Times misinterpreted Summers’ comments — which the paper claimed involved an argument that “women might lack an intrinsic aptitude for math and science.”
That is simply NOT what Summers claimed. He quite explicitly did not argue that the means of the distributions of mathematical ability in males and females differ. He merely noted that the evidence is clear that the distributions (of mathematical ability) for males and females are both normal distributions, but that the male distribution has a greater VARIANCE than is the case for females. Regardless of the reason for that difference (which he made no claims about), because of the difference in variance, when one examines the extremes of the distribution, males are going to be over-represented at both the upper and lower tails of the combined distribution.
For making that simple evidence-based observation – Summers was misinterpreted, forced to apologize, and ultimately forced to resign – all because critics (including scientists at Harvard and other elite universities – so not just reporters at the NY Times) did not seem to understand that his argument was based on the simple, and fascinatingly beautiful, statistical properties of overlapping normal distributions.
How can one not admire the beauty of a phenomenon so simple, so elegant, so ubiquitous, so easily understood — and at the same time so often misunderstood even by ivy league professors! I rest my case.